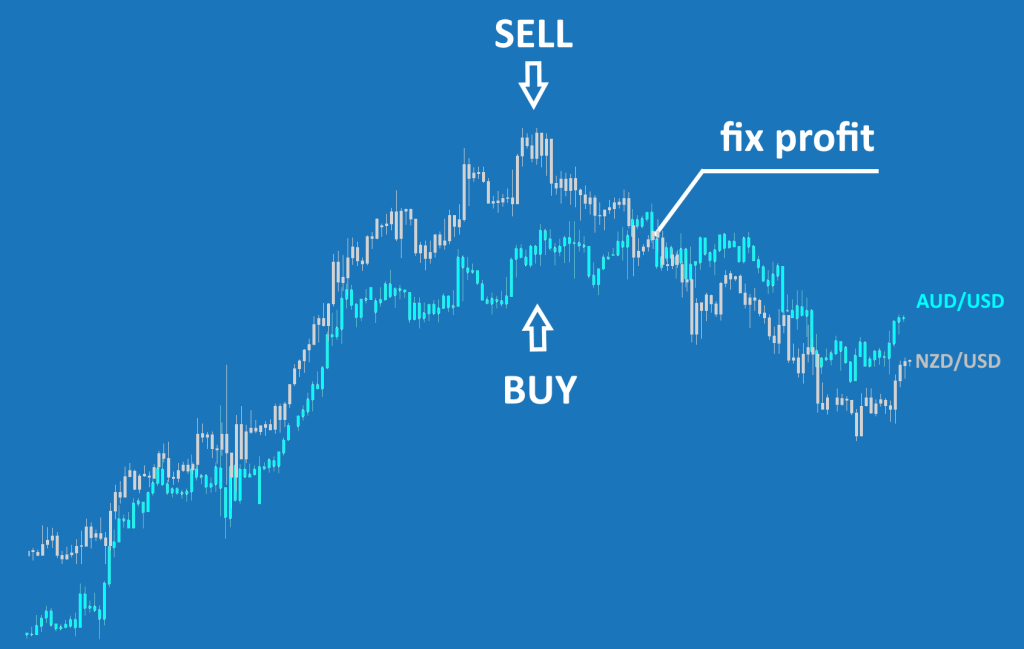
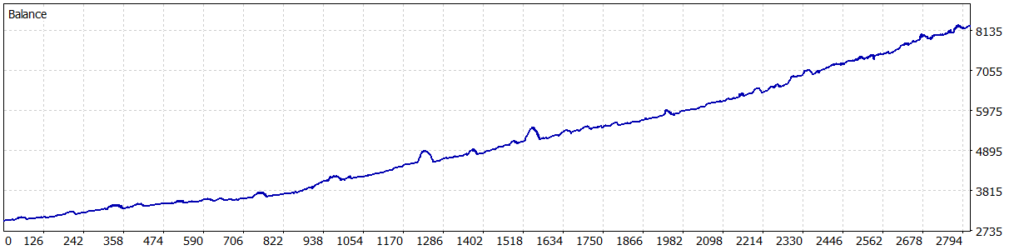
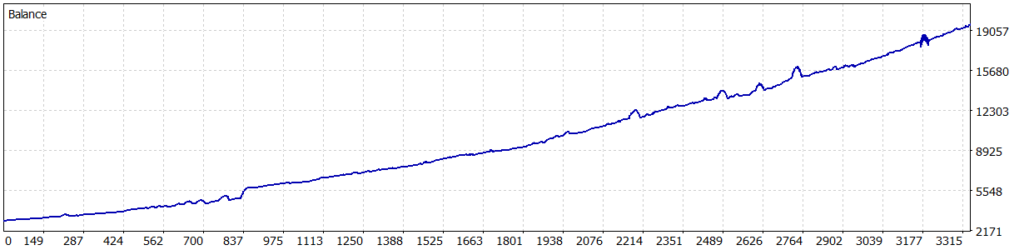
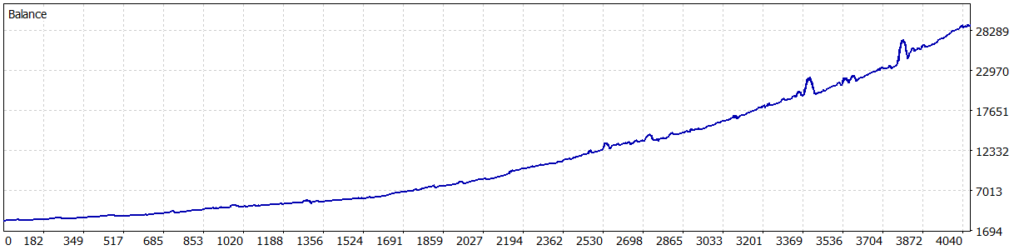
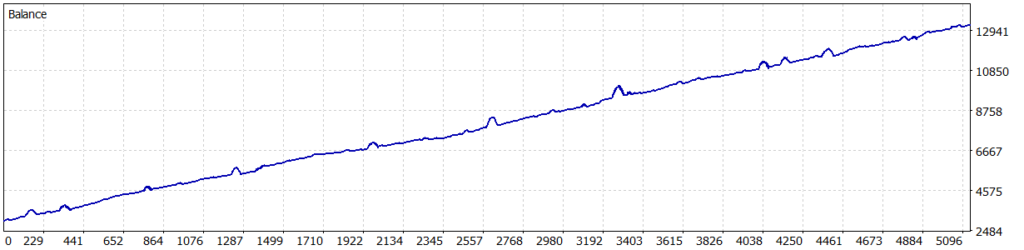
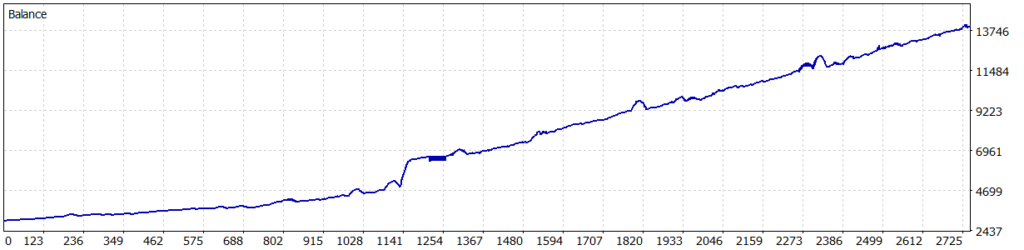
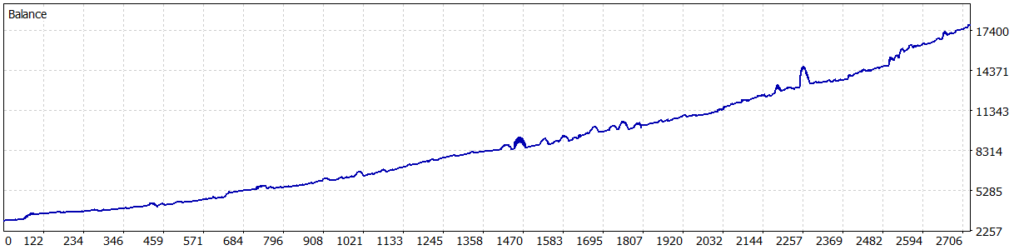
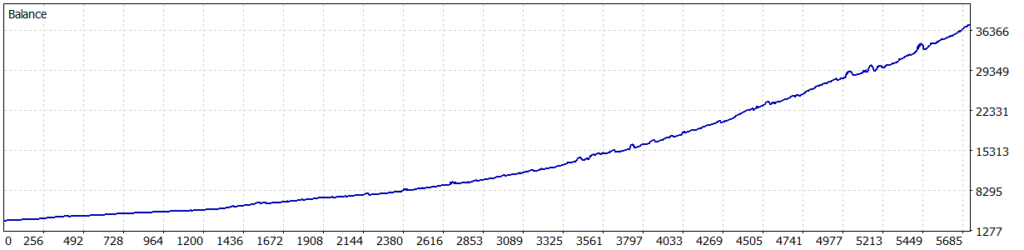
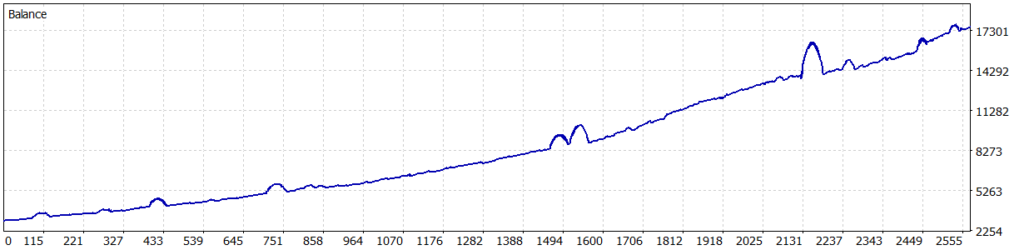
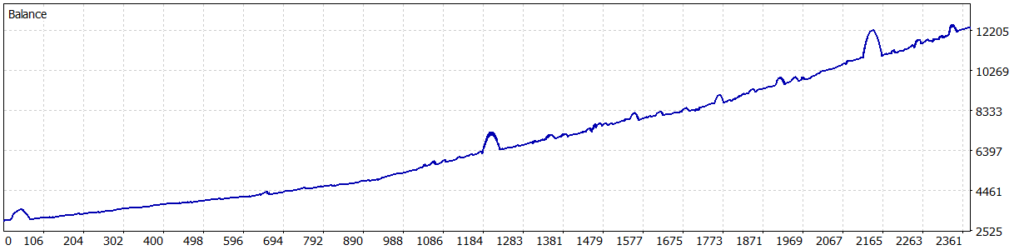
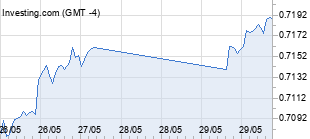
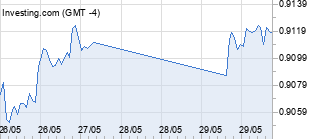
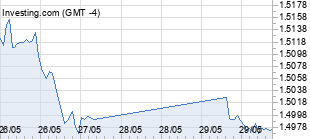
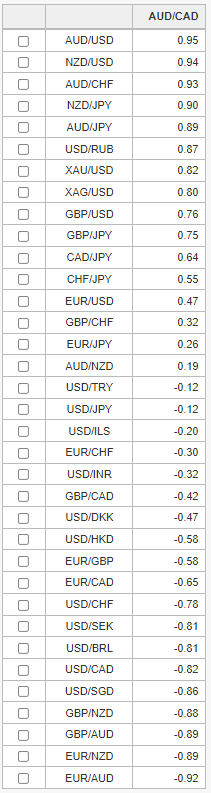
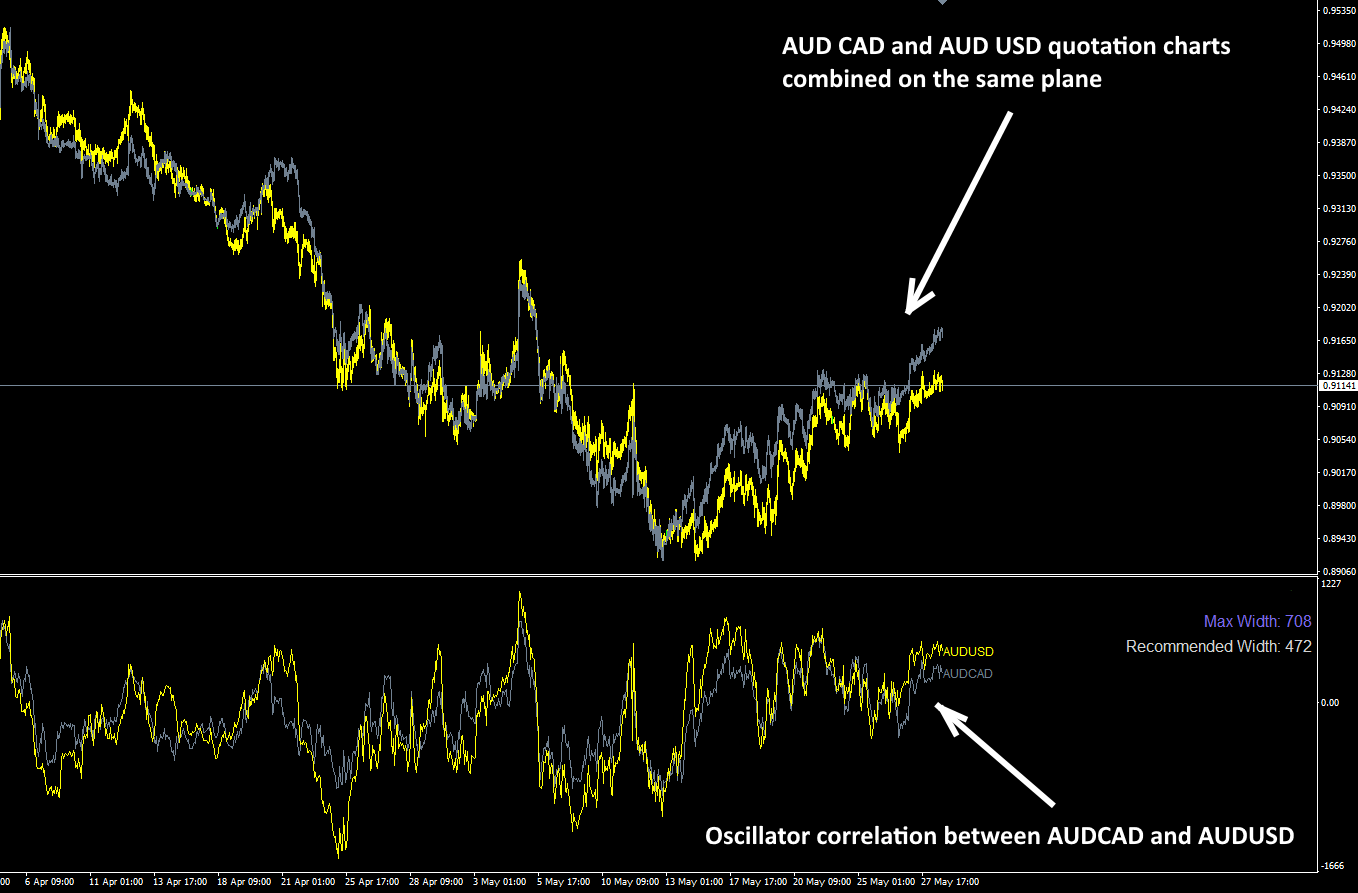
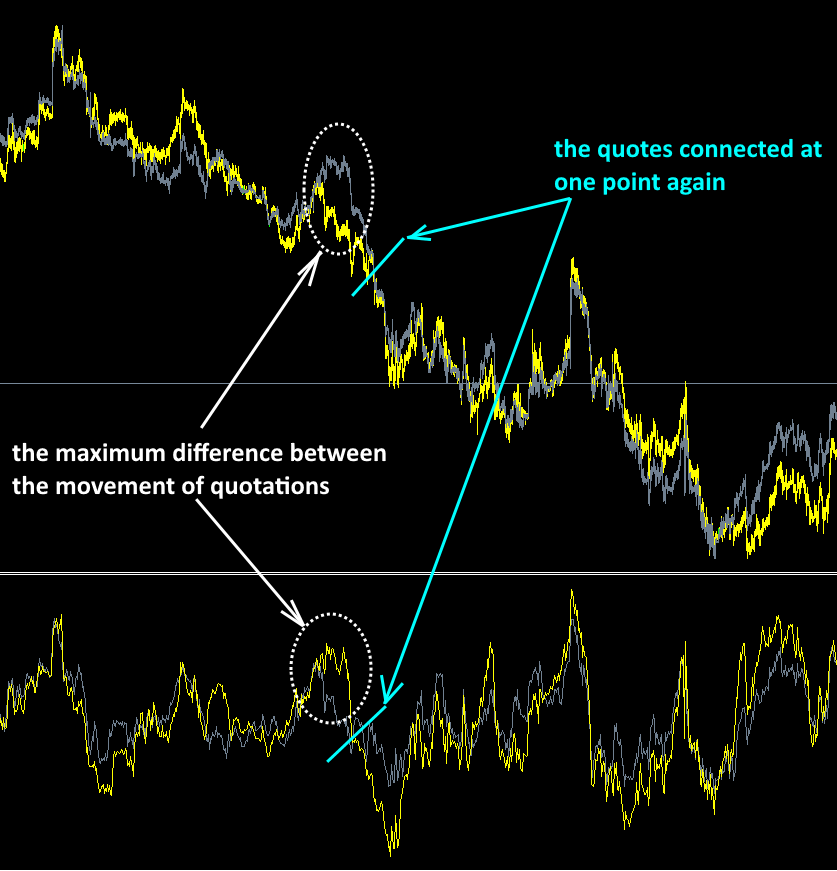
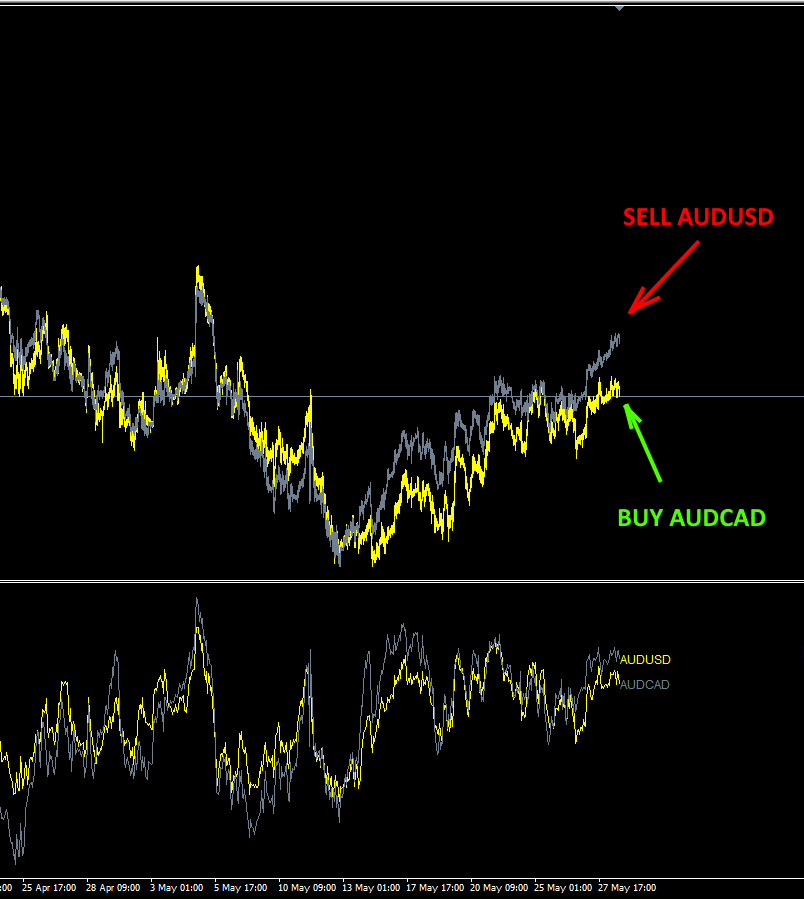
Range
Correlation EA
Simple yet profitable - that's the essence of the Forex correlation EA RANGE CORRELATION.
The strategy behind this Forex correlation EA RANGE CORRELATION, involves trading based on the correlation between related market assets. Here’s a brief and clear explanation of how it works:
It’s well-known that the quotes of many market assets often move in sync. For instance, pairs like AUD and NZD, EUR and GBP, or EUR and CHF generally trend in the same direction but may occasionally deviate from their usual path.
When such a deviation occurs, our MT5 trading technology kicks in: we sell the pair that has overextended and buy the pair whose quotes have dropped. Over time, the quotes of these pairs tend to realign, allowing the trader to secure a profit (as illustrated in the example below):
Imagine utilizing this trading approach across a broad array of correlated assets and on any timeframe. This allows you to build a highly diversified trading portfolio with minimal drawdowns and robust profitability, potentially exceeding 100% annually.
The Range Correlation EA serves as a valuable enhancement to any collection of automated expert advisors. In highly volatile markets, scalping expert advisors may incur losses, and trend-following robots struggle without clear market trends. However, the EA Range Correlator is designed to operate effectively under any market condition, at any time of the day, on any timeframe, and with nearly any asset! This versatility makes it an indispensable tool for maximizing trading opportunities.
Here is an example of how Range Correlation EA works in reality (test accuracy 99%):
Trading on Correlation between the AUDUSD-NZDUSD
Trading on Correlation between the AUDCAD-AUDCHF
Trading on Correlation between the EURCAD-EURAUD
Trading on Correlation between the EURCAD-EURNZD
Trading on Correlation between the EURJPY-CHFJPY
Trading on Correlation between the EURUSD-EURJPY
Trading on Correlation between the EURUSD-GBPUSD
Trading on Correlation between the EURUSD-NZDUSD
Trading on Correlation between the GBPJPY-CADJPY
Advantages of Range Correlator Forex EA:
Large portfolio
You can trade using almost any combination of currency pairs on any timeframe.
Stable profitability
You can earn over 100% per year, consistently, throughout many years of your life.
Easy to use
Our Forex Correlation EA is so user-friendly that even a child can set it up.
Universal strategy
Our Forex Correlation EA consistently turns a profit, irrespective of the market conditions.
What is Forex correlation?
You might have noticed that many assets appear to mimic each other’s movements, displaying similar patterns of rises and falls. We can assert with certainty that this isn’t coincidental, but a well-documented phenomenon that has been observed for many decades. This pattern is known as forex correlation. Leveraging this pattern, we have developed an effective forex correlation strategy and an expert advisor that operates based on this market pattern. But first, let’s begin by explaining what correlation is.
So, forex correlation is a similarity in the movement of currency pairs. By the way, this similarity is observed not only in the Forex market. Very often, cryptocurrencies, market indices and commodities show similar dynamics of movement. So, correlation is observed in any segment of the financial market and you can make money on it everywhere.
In practice, it works like this: Let’s explore this trend in the foreign exchange market. Using a specialized service, we’ll determine which currency pairs have movements similar to the AUDCAD pair.
Current statistics reveal that the AUDUSD pair exhibits the most similar movement dynamics, while the EURAUD pair shows the least similarity:
Positive correlation
AUDCAD chart
AUDUSD chart
Negative correlation
AUDCAD chart
EURAUD chart
To quantify the degree of similarity between assets, we use the forex correlation index, which ranges from -1 to 1. Assets with movements that closely mirror each other approach a correlation of 1. Those whose movements do not correlate are nearer to 0, and assets that move in opposite directions exhibit correlations close to -1.
Now that we understand that there are assets with highly similar movements—a phenomenon known as correlation—how can we leverage this to make money? To address this question, let’s explore another concept: the divergence and convergence (or collapse) of quotes of correlated assets.
We observe that the movements of many currency pairs closely resemble one another. To more effectively measure the extent of such correlations and to identify significant deviations in the movements of paired assets, we will overlay the quotes of two currency pairs. This will be done using a specialized indicator:
As evident, the forex correlation between these two quotation charts is quite substantial. Nevertheless, there are instances when the charts temporarily diverge. During these moments, the quotes of one currency pair might start to climb, while those of the other descend, creating a discernible gap or ‘window’ between the two charts on the same plane. It is during these times that the forex correlation index notably decreases.
Now, all that’s left is to execute two deals:
- For the currency pair whose quotes are lower – place a BUY order.
- For the currency pair whose quotes are higher – place a SELL order.
Remember, the forex correlation ensures that these two currency pairs typically move in close tandem. As a result, there will inevitably be a point when the currency quotes will realign, and the correlation index will revert to its mean value.
At this juncture, one or both of your trades will likely yield a significant profit, benefiting the trader.
We have just outlined a basic forex correlation strategy before your eyes, demonstrating how it can be profitably employed.
Correlation of forex pairs - choosing the best!
To identify the most correlated currency pairs, you can utilize specialized services that display the most similarly behaving quote charts, indicating currency pairs with the strongest positive and negative correlations. Alternatively, you can employ technical indicators designed to overlay the charts of two assets on the same plane. Another effective approach is to combine these two methods: use a service to pinpoint the best correlated forex pairs, and then apply special indicators to superimpose the quotes of these correlating pairs on the same chart plane to observe moments when they diverge significantly.
By implementing this strategy, you can assemble a diverse portfolio of 5-10 different correlating assets and effectively trade using the forex correlation strategy. This approach allows you to exploit the moments of maximum deviation between these pairs for potential profit.
Pierre –
EA Range Correlation offers exceptional flexibility across multiple currency pairs. It has consistently maximized my returns with minimal supervision
Arjun –
While the bot performs well in some conditions, it struggles during high market volatility, requiring more manual adjustments than I prefer.
Richard Taylor –
Its performance is decent but doesn’t always meet the high expectations set by its description. Better suited for experienced traders.
Claudia M –
The EA is superb for those looking for a robust trading strategy. It works well under various market conditions, providing substantial financial gains.
A Andersson –
I’m impressed with its stability and the substantial yearly profits. However, there’s a learning curve to fully harness its potential