
Forex Correlation EA
277,00 €
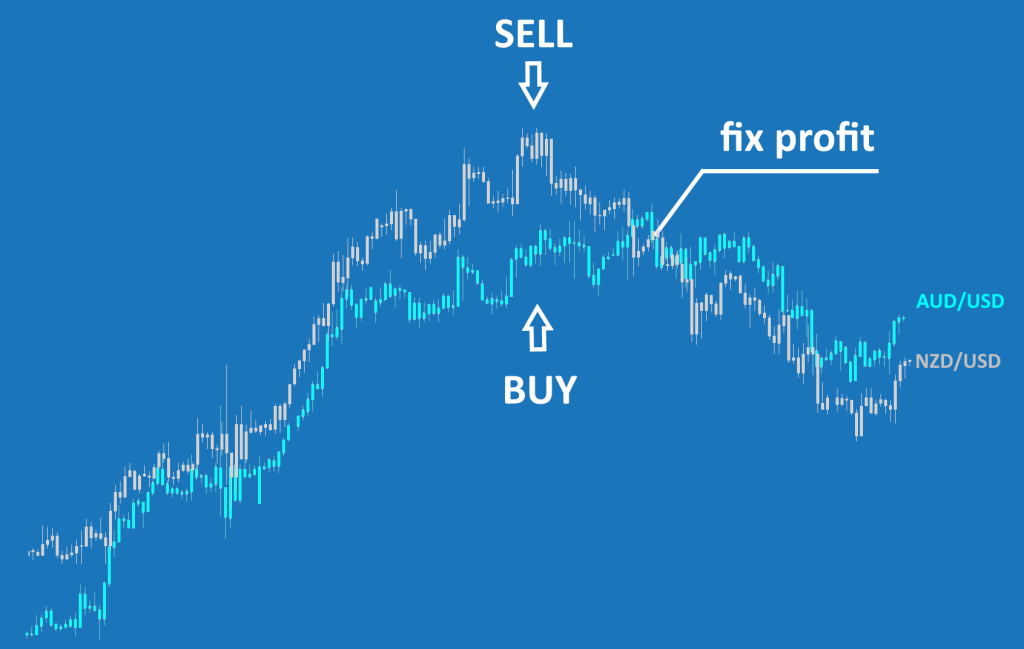
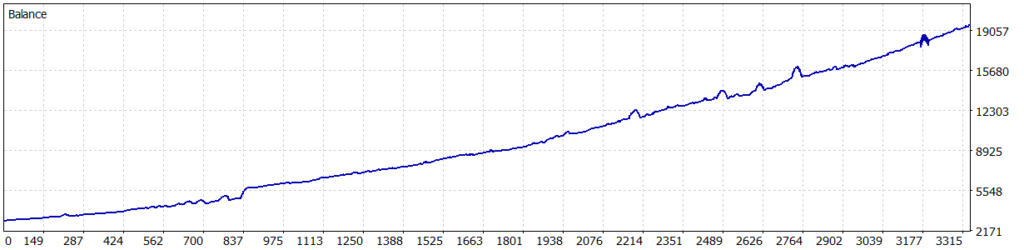
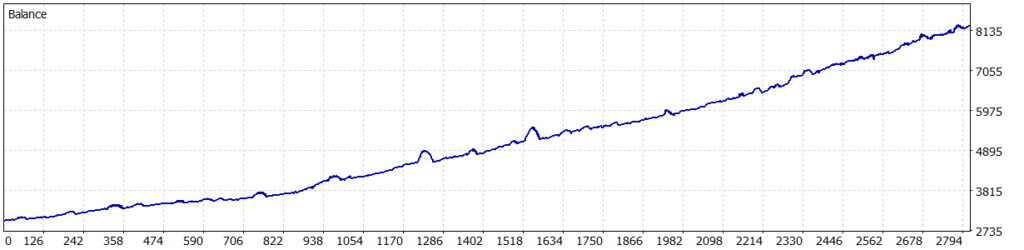
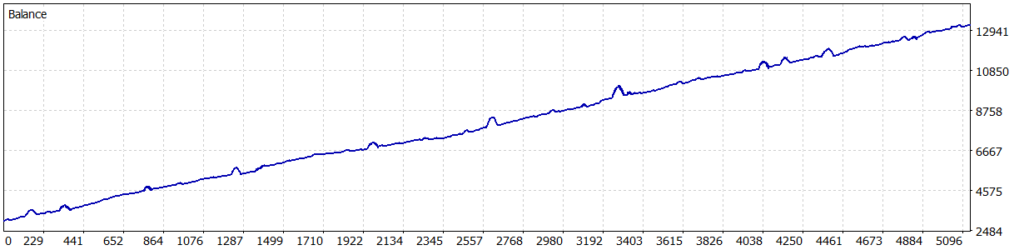
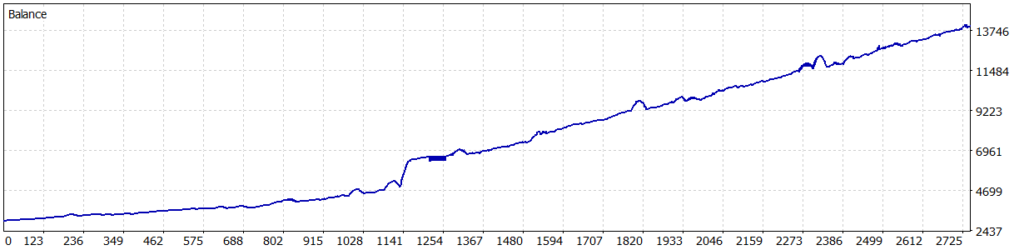
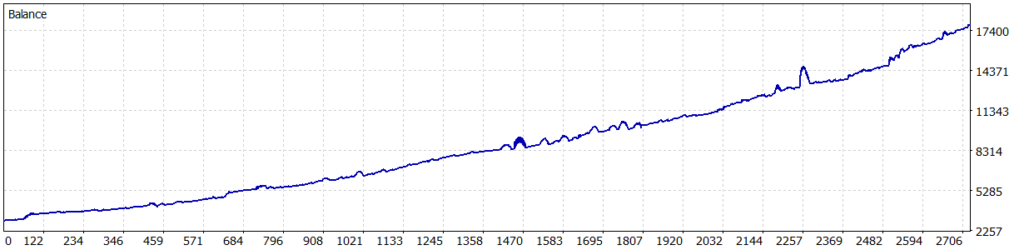
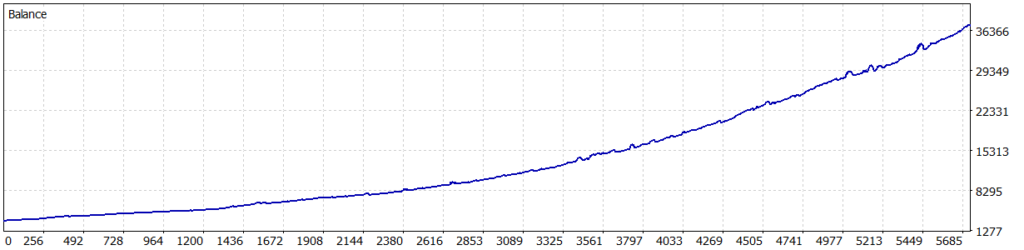
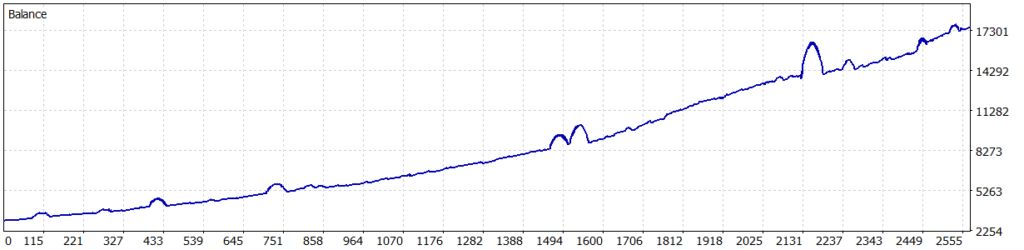
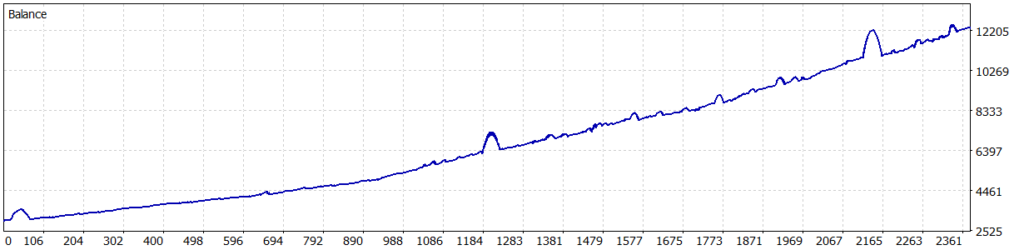
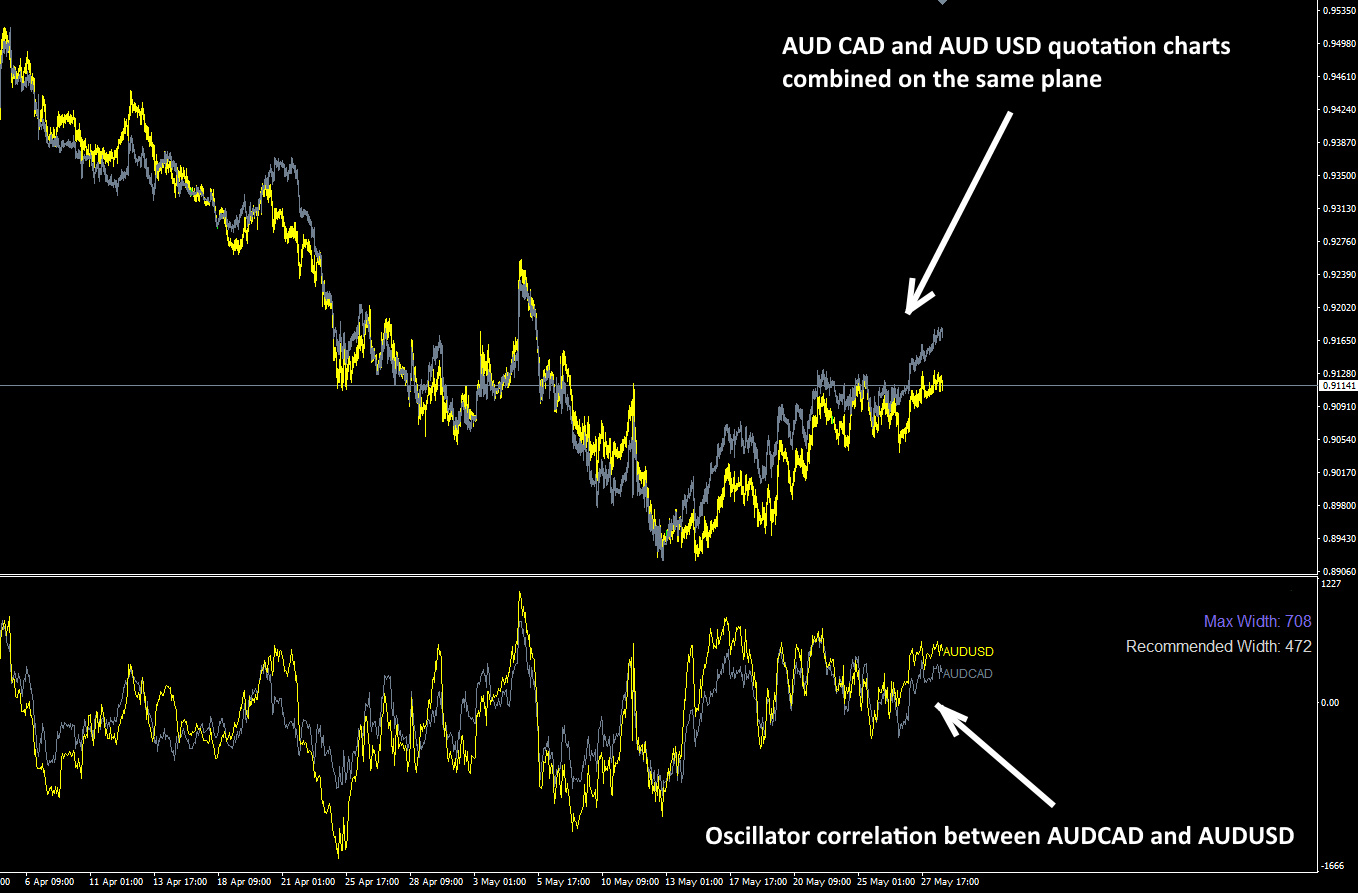
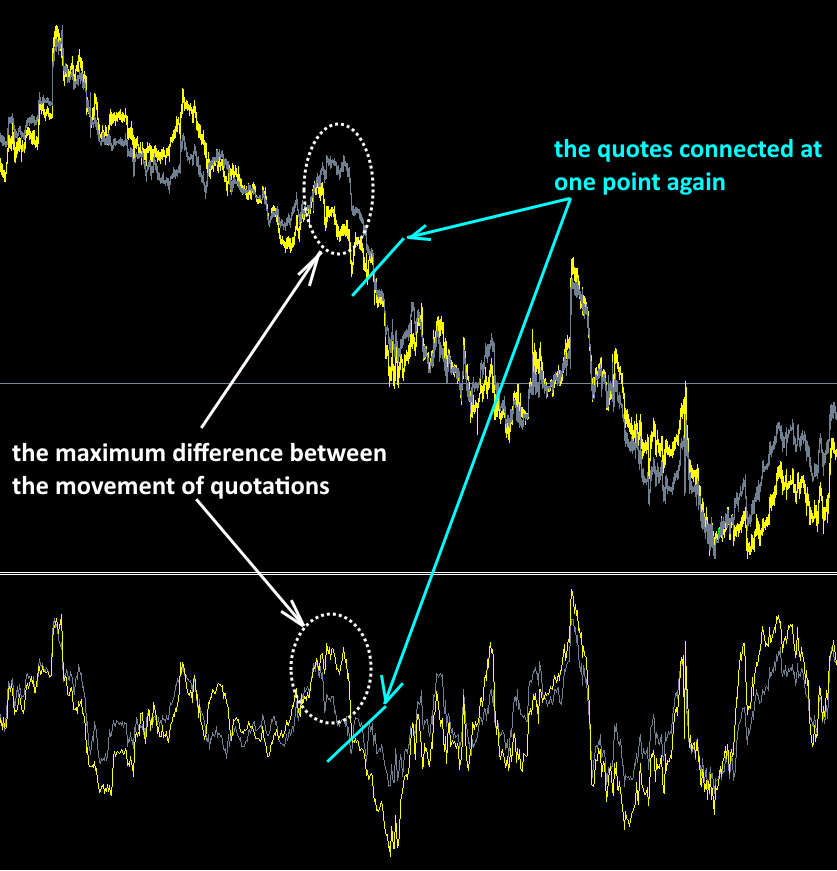
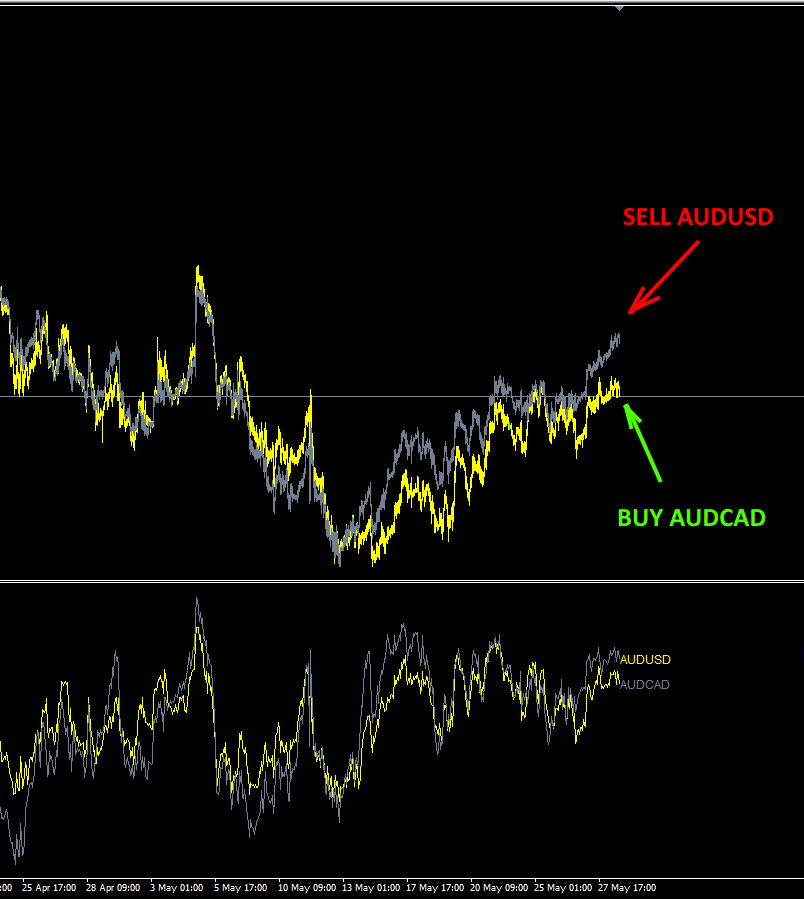
Range Correlation EA is a Expert Advisor for automatic trading on correlations between different currency pairs. Works on H1. Designed for the MT5.
- EA Range Correlator for MT5
- Unlimited license
- Detailed manual
- Presets for automatic configuration
- Technical support
7
Items sold in last 3 days
4
People watching this product now!
Description


Reviews (3)
3 reviews for Forex Correlation EA
Clear filtersYou must be logged in to post a review.
Delivery


Boris –
This is the most stable scalper in my entire collection! Doubled my deposit 3 times! Reliable software and I use it to the maximum!
Daniel OBrien –
Good Day Trading bot. I use it in combination with other experts on the same MT5 platform. Profitability is stable, drawdown is small.
Maximus –
I have been using this for 2 weeks. all strategies simultaneously on one account. +24% profit.