RSI Divergence Indicator
0,00 €
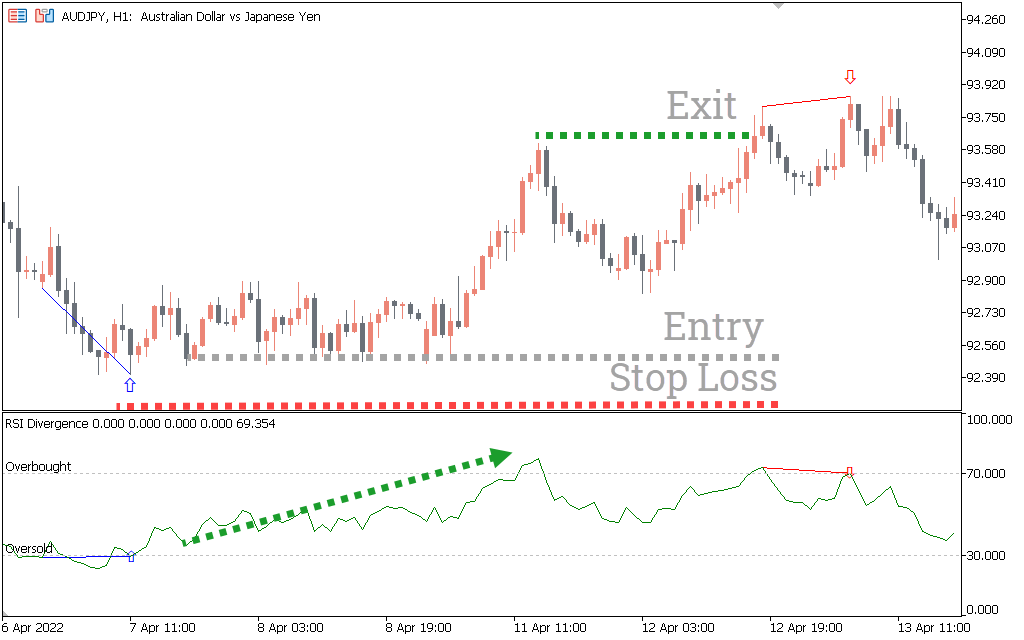
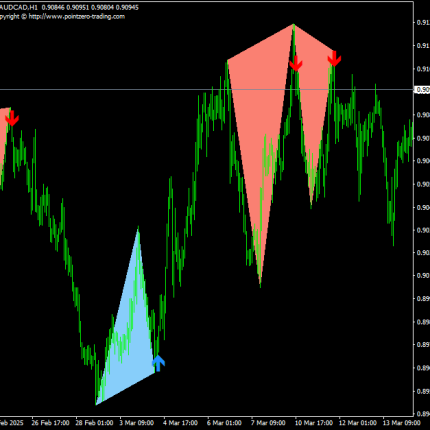
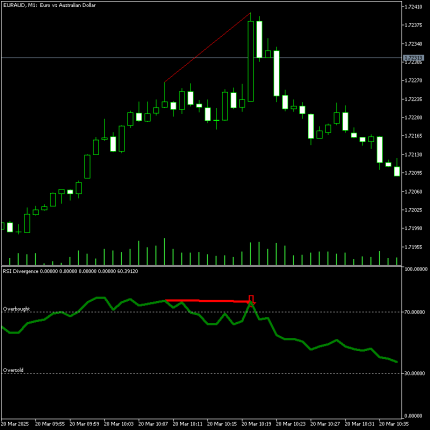
Combine the standard RSI Divergence indicator with price divergences to identify high-probability trade setups. This approach helps evaluate overbought and oversold conditions more effectively, providing accurate BUY/SELL signals based on momentum shifts and potential trend reversals.
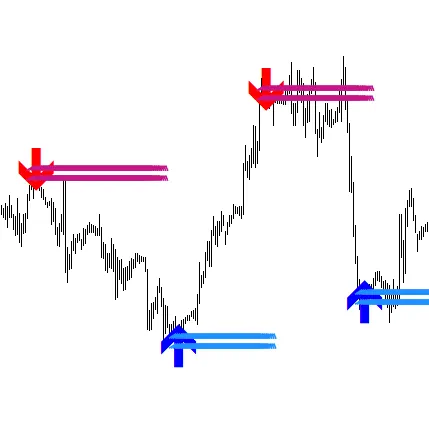
When price behavior and the Relative Strength Index (RSI) begin to display contradictory patterns, it suggests a possible change in market impetus—a critical occasion that the RSI Divergence Indicator pinpoints.
Comprehending RSI Divergence
The Relative Strength Index (RSI) serves as a momentum oscillator, gauging the swiftness and alterations of price movements. It spans from 0 to 100:
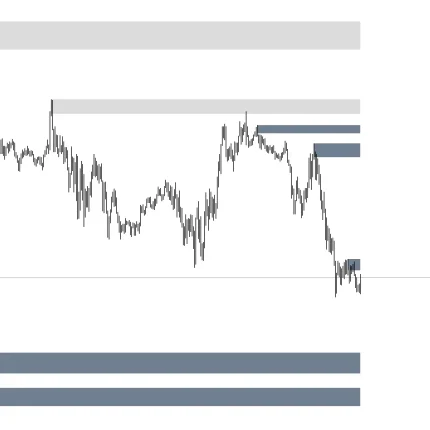
- Under 30 = Oversold (possibly a buying area)
- Over 70 = Overbought (possibly a selling area)
Nonetheless, a frequent downside of the conventional RSI is the rarity of its signals—it infrequently enters overbought or oversold territories, particularly within powerful trends. This is where divergence becomes relevant.
Super cool Forex indicator is here!!

Key Features:
- Profitability up to 500% per year
- Minimum deposit to start: $100 or more
- Timeframe for trading: M15
- Trading time: 24 hours a day
- Assets for trading: Any

How RSI Divergence Operates
Divergence arises when price behavior and the RSI indicator present contradictory messages:
Bullish Divergence Unfolds:
- Price exhibits decreasing lows
- RSI creates increasing lows
- Suggests a potential price increase
Bearish Divergence Emerges:
- Price demonstrates increasing highs
- RSI presents decreasing highs
- Signals a potential price decrease
This kind of divergence suggests a weakening of momentum within the current trend, which often occurs prior to a reversal or a substantial retracement.
RSI Divergence Indicator – Trading Alerts
Buy Alert (Bullish Divergence):
- RSI reaches oversold conditions
- Indicator illustrates increasing lows while price establishes declining lows
- Initiate a trade following confirmation from a candlestick pattern or when the RSI moves above 30
- Place a stop-loss near the recent price low
Sell Alert (Bearish Divergence):
- RSI reaches overbought conditions
- Indicator shows declining highs while price forms advancing highs
- Initiate a trade after validation or when the RSI dips below 70
- Position a stop-loss close to the latest price high
These alerts can be employed successfully in strategies designed around trend reversals or pullbacks, across forex, stock, and crypto markets.
In Summary
The RSI Divergence Indicator expands the classic RSI's usability by integrating divergence identification. This combined method overcomes the shortcomings of the base RSI, delivering more reliable buy/sell signals and providing a more thorough comprehension of likely market turning areas. It is an advantageous instrument for traders striving to capture trend reversals with enhanced accuracy.
The best trading robots are collected here!
You must be logged in to post a review.

Instant delivery after purchase
This digital product is delivered to the user's email instantly. You will receive an email with a download link immediately after your payment is confirmed.
Reviews
Clear filtersThere are no reviews yet.