QQE Indicator MT5
0,00 €
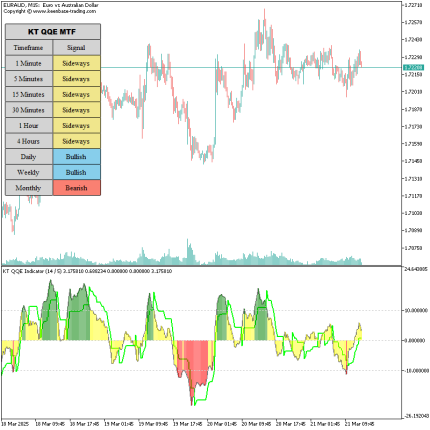
QQE indicator is a highly accurate MetaTrader 5 tool that provides incredible trade entry and exit points. Signal Reversal System. Suitable for beginners traders.
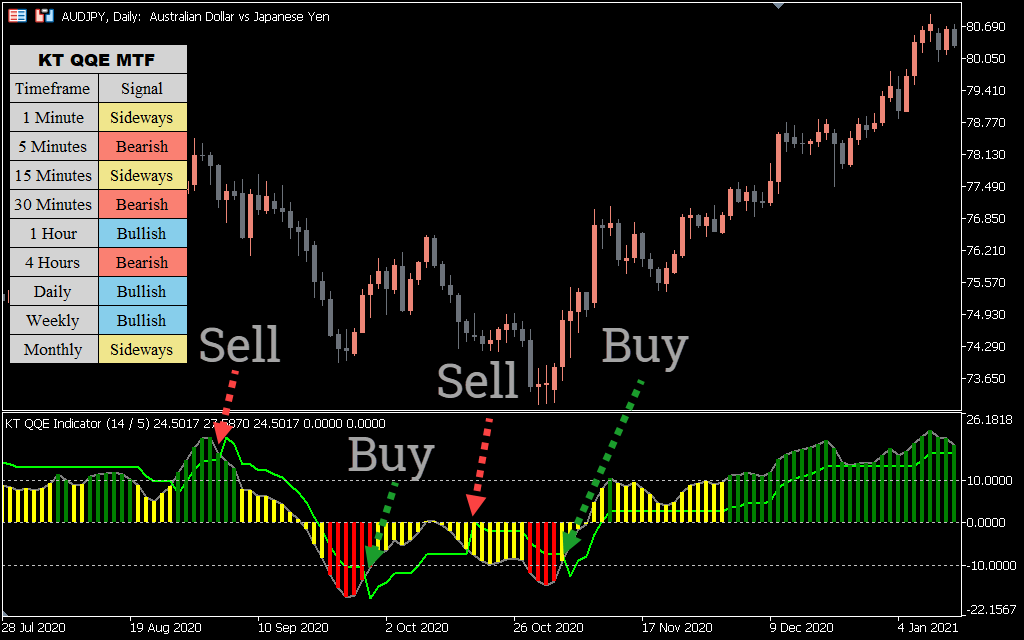
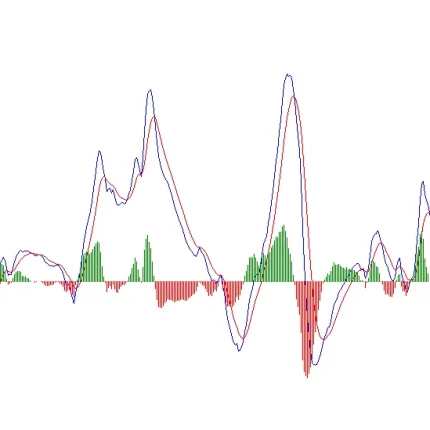
The QQE, short for Qualitative Quantitative Estimation, is a MetaTrader 4 indicator based on the Relative Strength Index (RSI). Its core is the RSI, but with the addition of a smoothing algorithm. Its strength lies in its proven dependability across different market climates, notably surviving the turbulent conditions following the 2008 financial crisis. The QQE is characterized by a lack of significant lag and a low incidence of misleading signals, setting it apart from other tools.
Employing the QQE for Trend-Based Trading
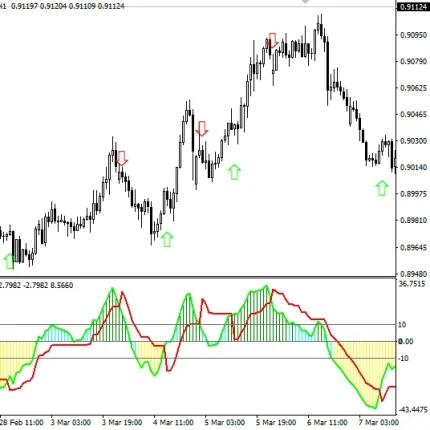
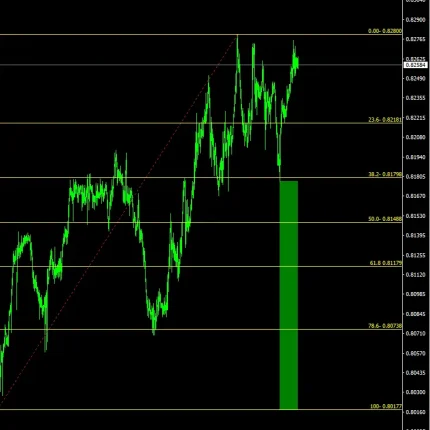
The primary function of the QQE indicator is the identification of market trends. A bullish signal is generated when the indicator's value moves above 10, which encourages traders to consider long positions. On the other hand, crossing below the 10 level triggers a bearish signal, thus suggesting the possibility of entering short positions. This makes QQE especially beneficial when aiming to filter trade signals with respect to the general market direction.
Super cool Forex indicator is here!!

Key Features:
- Profitability up to 500% per year
- Minimum deposit to start: $100 or more
- Timeframe for trading: M15
- Trading time: 24 hours a day
- Assets for trading: Any

Overbought and Oversold Conditions
QQE can also identify overbought and oversold conditions. When the indicator surpasses the 12+ level, it suggests strong bullish momentum and a potential opportunity to enter a long trade. If the indicator moves toward negative values, it may indicate overbought conditions and a possible setup for a short position.
Detecting Divergence with QQE
QQE is effective in spotting divergence between price and momentum:
- Bullish divergence occurs when QQE forms higher lows while price creates lower lows — a signal of a possible upward reversal.
- Bearish divergence appears when QQE forms lower highs while price sets higher highs — suggesting a potential downward reversal.
Momentum shifts can also be identified when the bold line (smoothed RSI) crosses the trailing line:
- A bullish signal occurs when the bold line crosses above the trailing line.
- A bearish signal is triggered when the bold line crosses below the trailing line.
Trading Example
In the example of EUR/USD on the daily chart, the gray line (representing the smoothed RSI) follows price movement closely, with minimal lag. The indicator provides a sell signal when the gray line drops below the green trailing line. Similarly, a buy signal appears when the gray line crosses above the trailing line. These crossovers are often followed by strong price movement in the direction of the signal.
Conclusion
The QQE indicator is among the most accurate technical tools available. It offers various trading strategies through its buy and sell signals, helps detect trend reversals, and improves trade timing. Given its versatility and reliability, it's a valuable addition to any trader’s toolkit.
The best trading robots are collected here!
You must be logged in to post a review.

Instant delivery after purchase
This digital product is delivered to the user's email instantly. You will receive an email with a download link immediately after your payment is confirmed.
Reviews
Clear filtersThere are no reviews yet.