Chop Zone Indicator
0,00 €
Chop Zone Indicator is an excellent trend indicator for the MT5 platform that works on any asset and shows price trends and price reversals.
The Chop Zonei Indicator MT5 is a streamlined market-state filter built to instantly separate trending conditions from sideways chop. Instead of flooding the chart with lagging signals or unnecessary overlays, it uses a color-coded histogram to show whether momentum is bullish, bearish, or flat. This makes market context obvious and lets traders focus on execution rather than overanalyzing price action.
When I first tested this tool on lower timeframes like M15, I was impressed by how quickly it adjusted to shifting market behavior. The smooth transition between bullish, bearish, and neutral colors made it much easier to sidestep low-quality entries during consolidation. It’s especially effective for breakout traders who want to avoid fake moves and for trend followers looking for directional confirmation.
Chop Zonei Indicator MT5: Signal Logic Explained
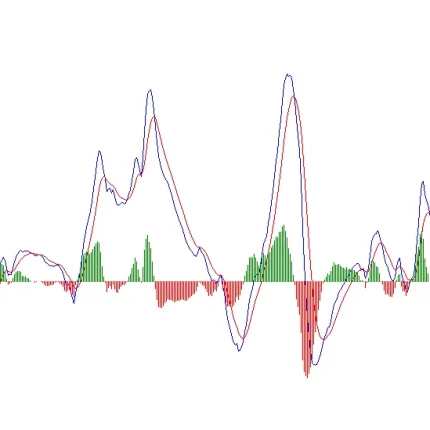
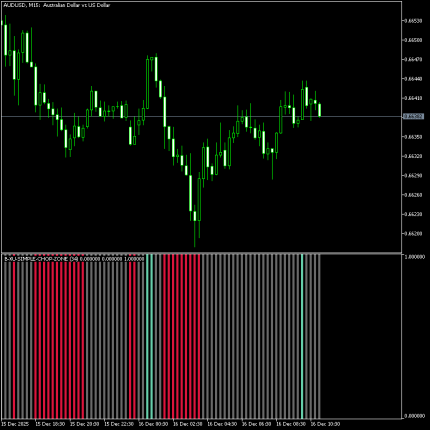
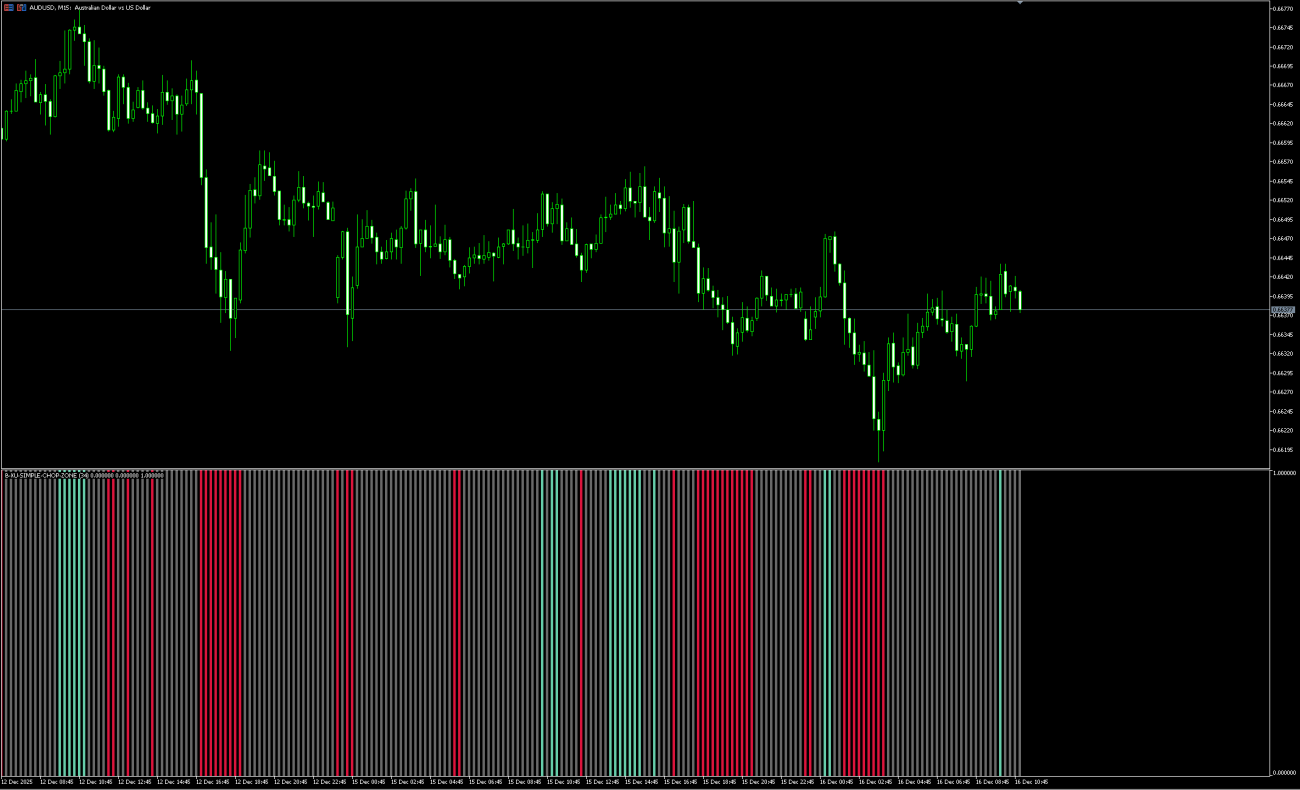
The Chop Zonei Indicator MT5 determines market conditions by measuring the angle of an exponential moving average. When the EMA slope exceeds a positive threshold, the histogram flips green — signaling a bullish momentum phase where buyers are clearly in control. These periods tend to favor trend continuation trades and clean breakout setups.
When the EMA angle drops below a negative threshold, the histogram turns red, indicating bearish dominance. In these phases, short trades typically have higher follow-through as sellers drive price action.
If the EMA angle remains between the upper and lower thresholds, the histogram turns gray. This marks a choppy, low-momentum environment often associated with consolidation or range-bound trading. From my experience, respecting these gray zones and staying flat during them dramatically improves consistency and keeps drawdowns under control.
The best trading robots are collected here!
Conclusion: A Simple Filter with Real Impact
The Chop Zonei Indicator MT5 is a highly practical tool for visually defining market phases with minimal noise. Its intuitive color system makes it easy to identify when the market is worth trading — and just as importantly, when it’s not.
Whether used as a standalone market-state gauge or as a filter for breakout and trend-following strategies, it adds structure, discipline, and clarity to decision-making. In my own trading, avoiding entries during gray chop zones has proven to be a small adjustment with a big performance payoff.
Instant delivery after purchase
This digital product is delivered to the user's email instantly. You will receive an email with a download link immediately after your payment is confirmed.
