MA Multi Timeframe indicator
0,00 €
The MA Multi Timeframe indicator is a technical analysis instrument that helps determine the strength of a trend. With this indicator you can spot the trend at a glance.
By presenting all relevant moving average signals in one place, the indicator helps reduce effort and improves decision-making speed.
How the MA Multi Timeframe indicator Works
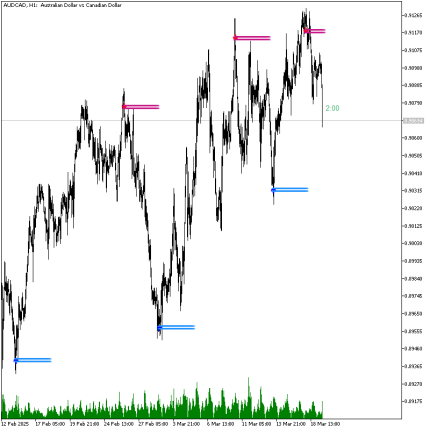
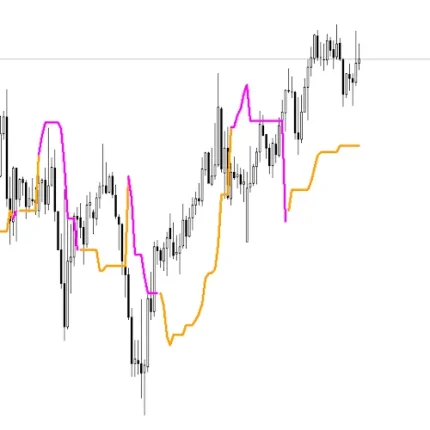
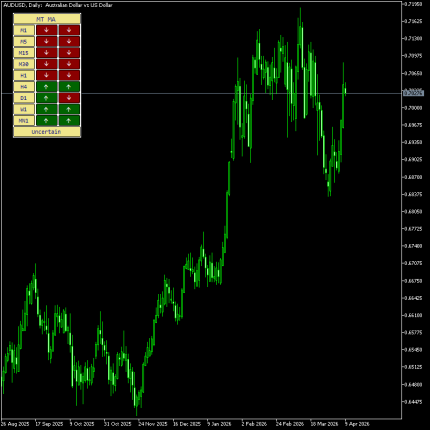
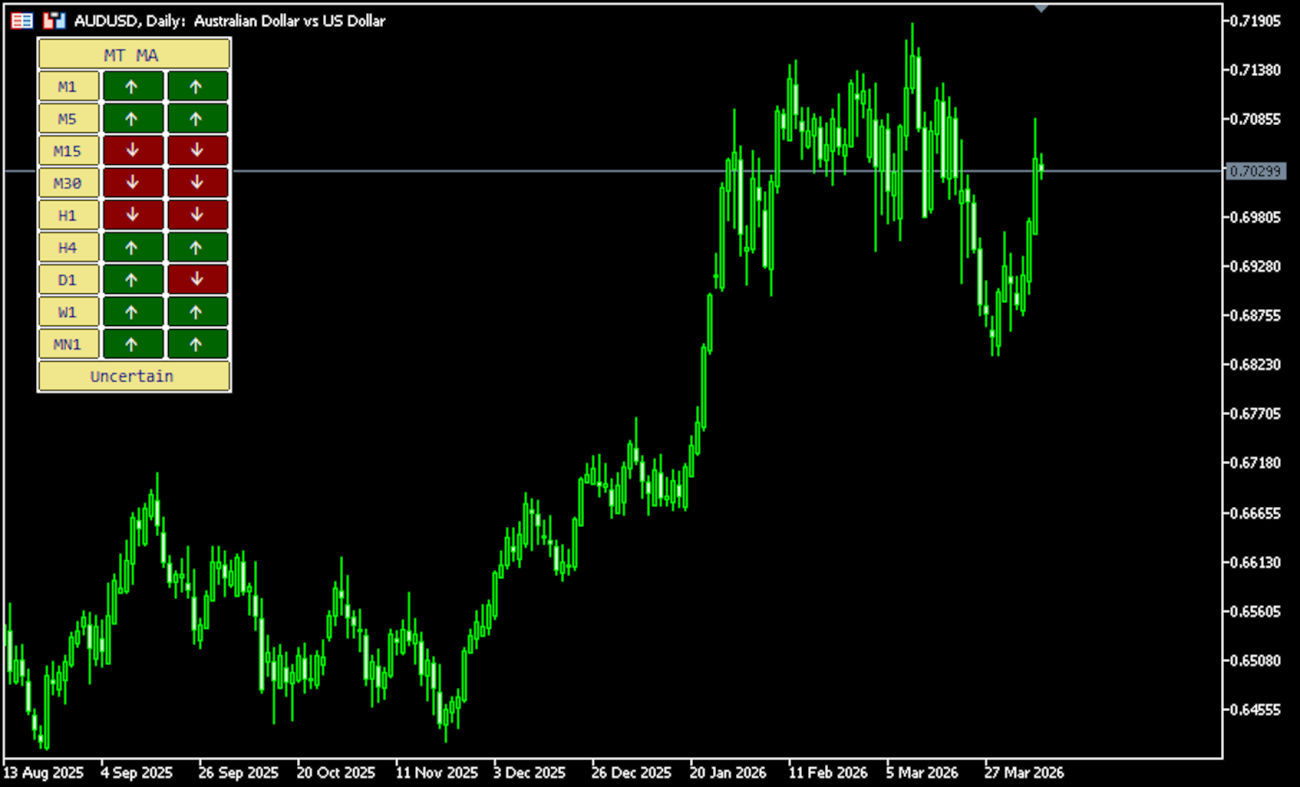
The MA Multi Timeframe indicator displays both short-term and long-term trend conditions simultaneously. It shows whether price is positioned above or below the moving average across selected timeframes.
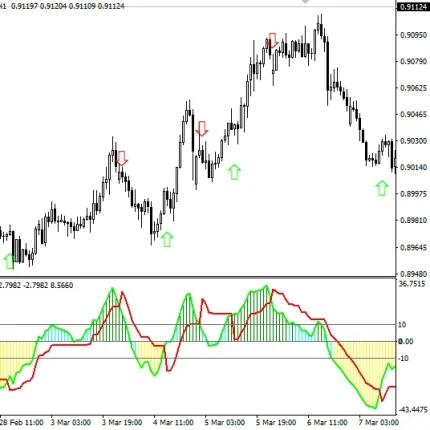
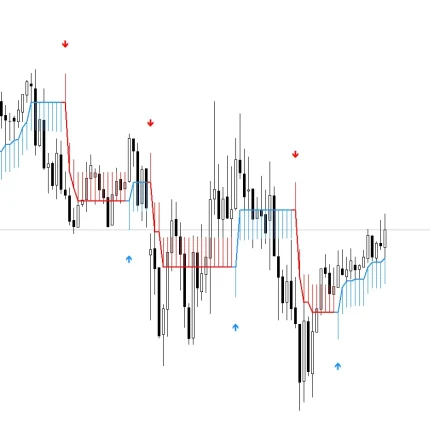
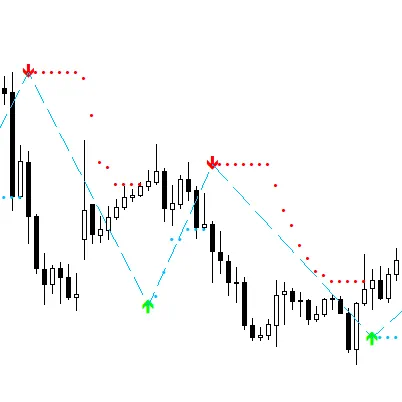
Visual arrows make interpretation simple: green arrows indicate that price is above the moving average, suggesting bullish pressure, while red arrows show that price is below the average, indicating bearish conditions.
When all arrows align in one direction, it reflects a strong and consistent trend. Mixed signals, on the other hand, often indicate consolidation or market uncertainty.
The MA Multi Timeframe indicator also allows full customization. Traders can adjust the moving average period and apply either identical or different settings across timeframes, depending on their strategy.


MA Multi Timeframe indicator Trading Strategy
A simple approach using the MA Multi Timeframe indicator focuses on trend alignment.
For buy setups:
- Set the moving average period to 20 across all timeframes
- Wait until all arrows turn green, confirming bullish alignment
- Look for additional confirmation from price action, such as a completed bullish candle
- Enter a buy position at market price
- Place stop loss below the recent swing low
- Set take profit near the next key level or round number
For sell setups:
- Use the same period settings
- Wait for all arrows to turn red, confirming bearish alignment
- Confirm the signal with a bearish candle formation
- Enter a sell position at market price
- Place stop loss above the recent swing high
- Set take profit near the next important level
This method helps traders align entries with the dominant trend direction.
Conclusion MA Multi Timeframe indicator
The MA Multi Timeframe indicator is a practical tool for identifying trend direction and strength across multiple timeframes. It significantly reduces the need for manual chart switching and simplifies complex analysis.
However, it should not be used as a standalone system. For best results, the MA Multi Timeframe indicator should be combined with additional tools such as price action, support and resistance, or other confirmation methods to improve trade accuracy.