Point and Figure Indicator MT5
0,00 €
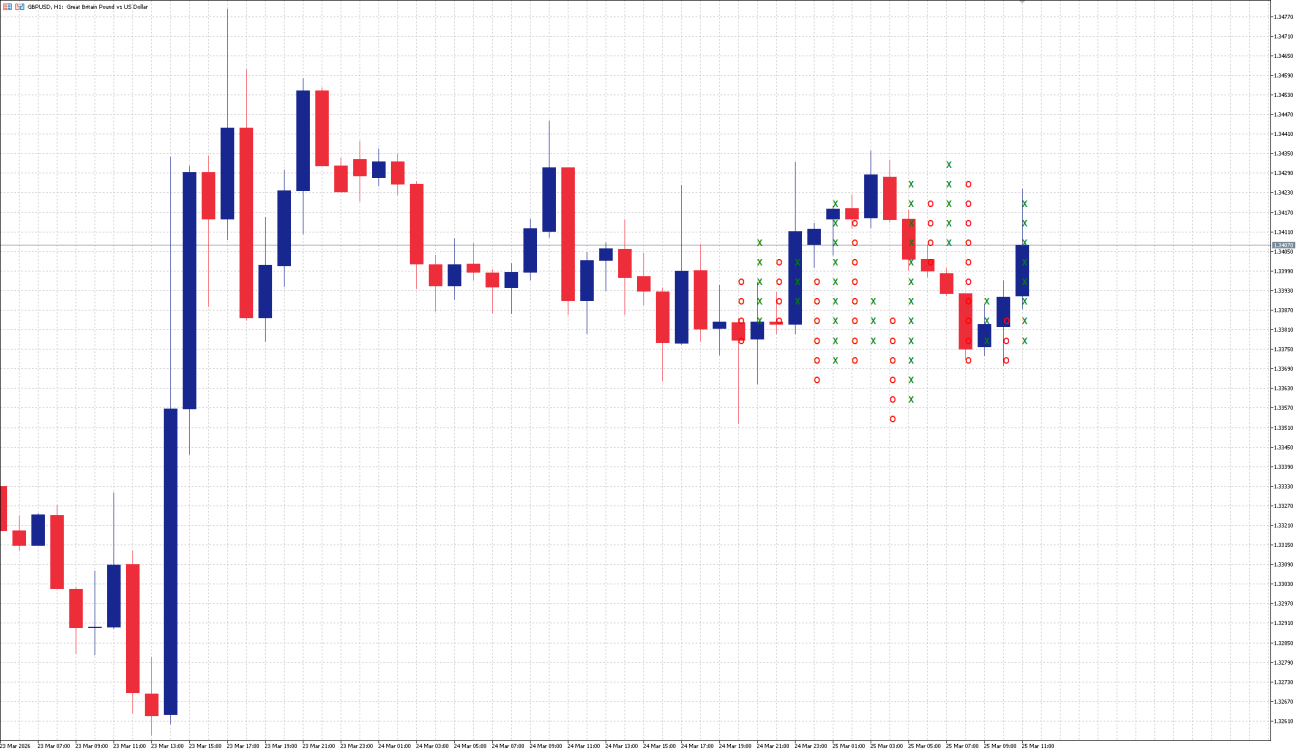
The Point and Figure Indicator for MT5 excels at cutting through market distortions to illuminate genuine directional movements, employing columns of ‘X’s and ‘O’s to pinpoint exact moments of breaking through resistance or support.
In practice, tools that reduce noise often improve trade quality. The Point and Figure Indicator supports this by shifting attention toward market structure rather than short-term distractions.
Point and Figure Indicator Trading Signals
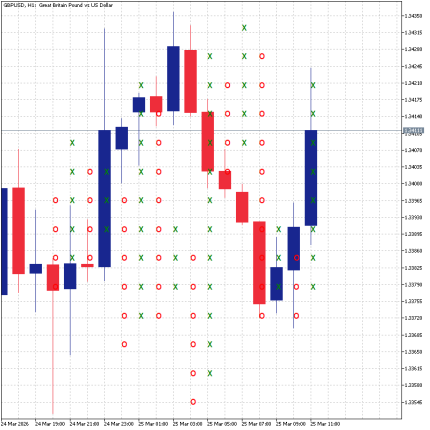
The Point and Figure Indicator represents price action using columns of X and O symbols. X columns reflect upward price movement and bullish pressure, while O columns indicate downward movement and bearish momentum.
A key signal occurs when the chart transitions from an O column to an X column. This shift suggests that buyers are gaining control and that the market may be entering a bullish phase. Conversely, a move from X to O reflects increasing selling pressure and potential bearish continuation.
One of the most important signals within the Point and Figure Indicator is the breakout. When a column of X exceeds the previous high, it indicates a potential bullish breakout. Similarly, when a column of O breaks below a previous low, it suggests continued downward movement.


Because the indicator filters out small fluctuations, these breakout signals tend to be more reliable than those generated by traditional charting methods. Instead of reacting to every price movement, traders focus only on confirmed structural changes.
Another important concept is reversal filtering. The indicator changes direction only after price moves a predefined distance, which helps eliminate false signals. This built-in logic is one of the reasons why experienced traders often rely on this approach.
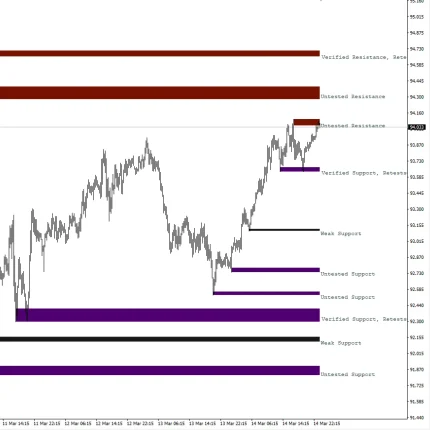
In real trading scenarios, combining signals from the Point and Figure Indicator with key support and resistance levels can significantly improve trade selection. When breakout patterns align with major levels, the probability of a successful trade increases.
Conclusion Point and Figure Indicator
The Point and Figure Indicator offers a clear and structured way to analyze price action without unnecessary noise. Its unique format provides traders with a different perspective, making it easier to identify trends and breakout opportunities.
By focusing entirely on price movement rather than time, it complements traditional chart analysis and helps filter out weak signals. The Point and Figure Indicator remains a reliable tool for traders who want to concentrate on meaningful shifts in market direction and improve overall decision-making.