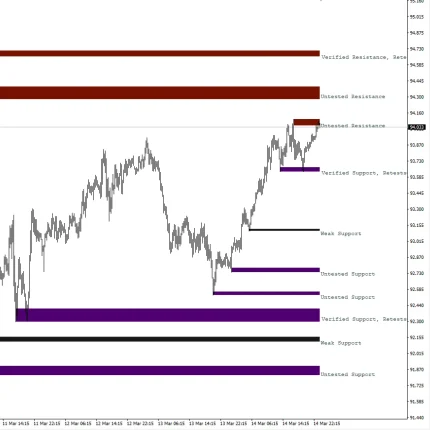
The Supply and Demand Range Indicator is an advanced analytical tool for MetaTrader 5 that automatically identifies key supply and demand zones based on the visible area of the chart. Instead of relying on fixed historical calculations, it adapts in real time to what the trader is currently viewing, making it highly practical for active decision-making.
One of the main issues traders face is working with outdated levels. Traditional tools often calculate zones using a fixed number of candles, ignoring the current market context. The Supply and Demand Range Indicator solves this by recalculating zones dynamically according to the visible range, ensuring that analysis always reflects the latest price behavior.
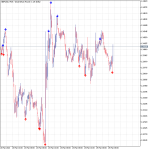
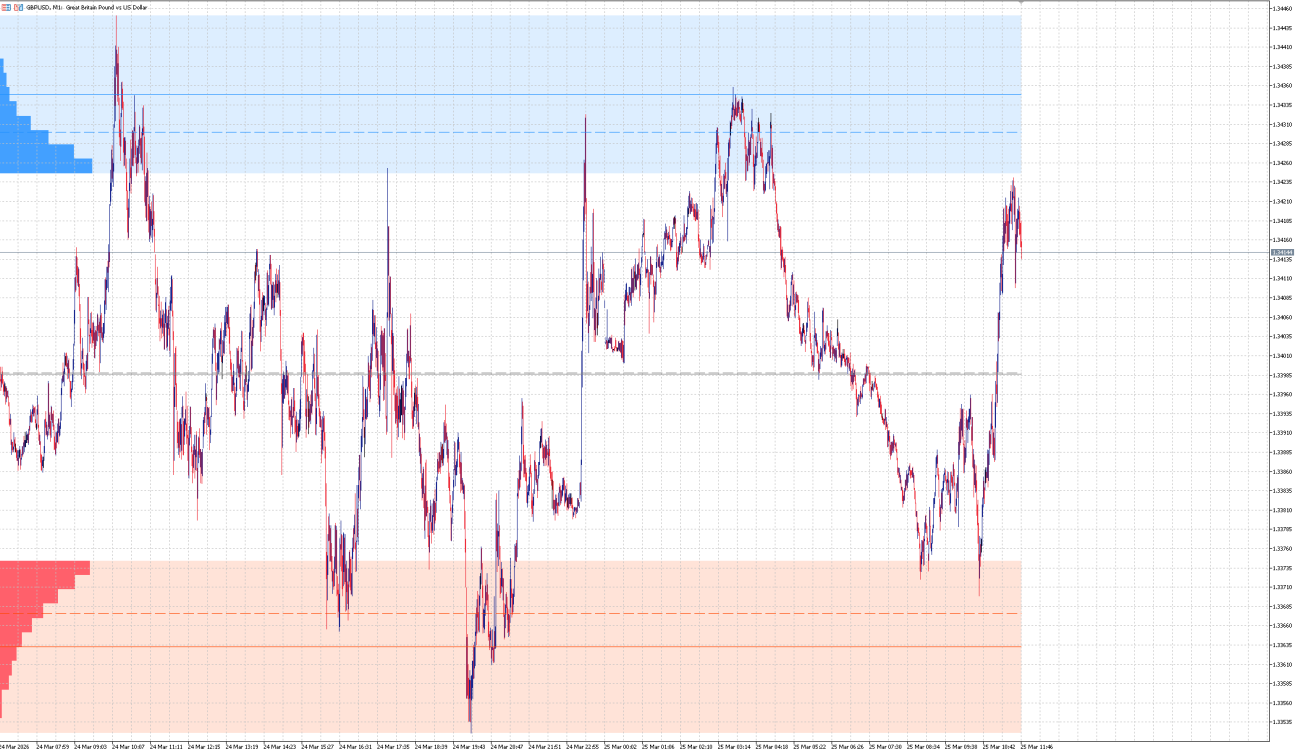
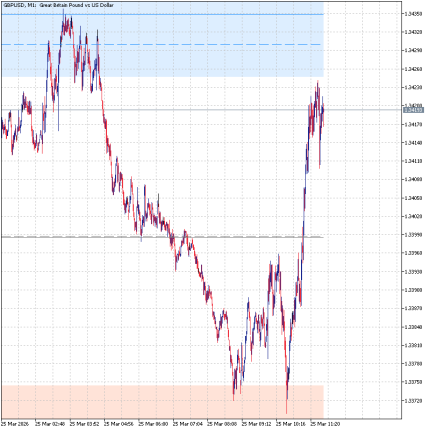
The indicator highlights supply zones where selling pressure is expected, demand zones where buying interest appears, and an equilibrium level that represents market balance. This structure provides a clean and intuitive view of price interaction, allowing traders to quickly assess potential reactions.
From a practical perspective, the Supply and Demand Range Indicator is especially useful in fast-moving intraday environments. As the chart is scrolled or zoomed, zones update instantly, offering a more accurate understanding of current liquidity and market conditions.
Supply and Demand Range Indicator Trading Signals
The Supply and Demand Range Indicator does not generate traditional buy or sell arrows. Instead, it provides structural zones that traders can use to interpret market behavior.
When price enters a demand zone, it reflects an area where buyers previously showed strong interest. If price revisits this zone, it often reacts again, creating potential long opportunities. This makes the Supply and Demand Range Indicator particularly useful for identifying continuation or reversal setups.
Supply zones represent areas where sellers previously dominated. When price returns to these zones, it may face resistance and produce short opportunities. The strength of the reaction depends on market momentum and the context in which price approaches the level.
The equilibrium level plays a key role in understanding overall market positioning. When price is above this level, it suggests a premium environment; when below, it indicates a discount. This helps traders filter trades and align entries with broader market bias.
In practice, the most effective setups occur when price moves from equilibrium into supply or demand zones in a natural flow. Sharp rejections from these zones often provide higher-quality entries, while slow consolidation inside them may indicate weaker trading conditions.
Conclusion Supply and Demand Range Indicator
The Supply and Demand Range Indicator is a powerful visualization tool that brings clarity to market structure by focusing on current price action within the visible chart area.
It is particularly valuable for active traders who require real-time levels instead of static historical zones. By combining supply, demand, and equilibrium into one structured view, the Supply and Demand Range Indicator allows for faster and more confident decision-making.
When combined with proper price action confirmation, this tool can significantly improve entry timing and overall trade quality.
Delivery
Instant delivery after purchase
This digital product is delivered to the user's email instantly. You will receive an email with a download link immediately after your payment is confirmed.