How the MA Multi Timeframe Indicator Works
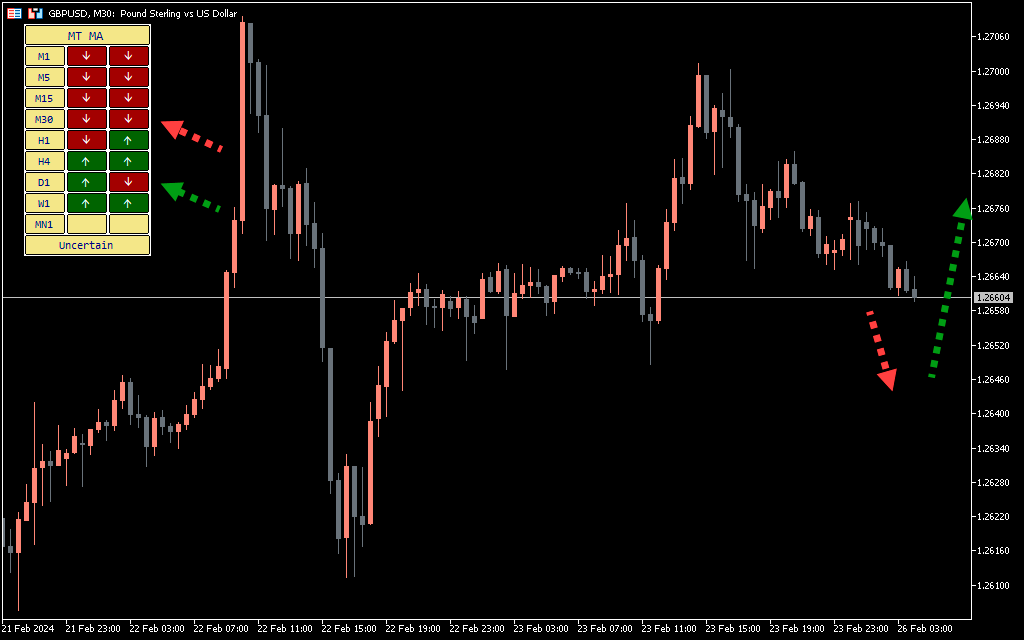
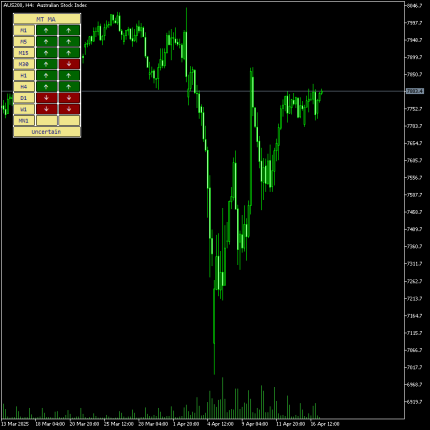
The beauty of this tool lies in its simplicity and clarity. It displays whether price is trading above or below a chosen moving average on different timeframes, making it easy to spot consistent trends or market indecision.
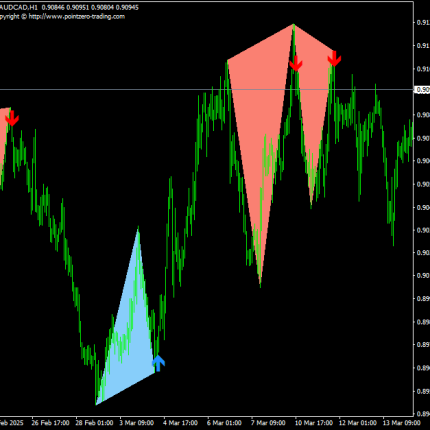
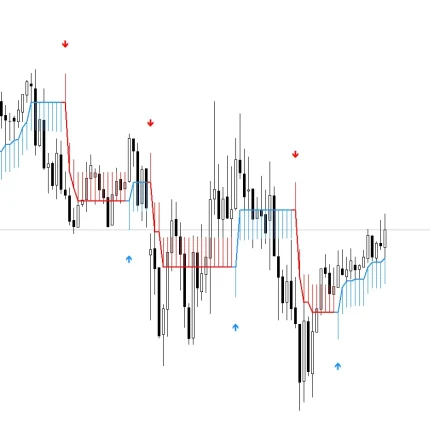
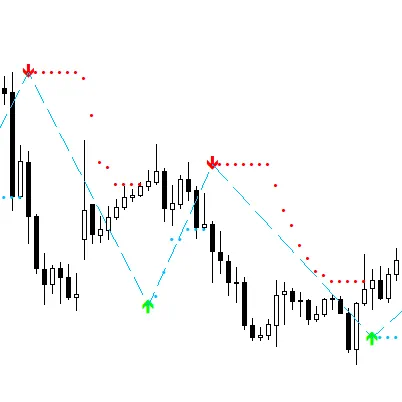
For example, when viewing a chart like GBP/USD, you’ll see arrows—green when price is above the moving average, and red when it’s below. If all arrows across timeframes are green, you’re likely in a strong uptrend. If they’re all red, the trend is clearly bearish. When the colors are mixed, it usually signals consolidation or sideways movement.
One of the useful features is that you can adjust the moving average period. You might choose to use the same period across all timeframes or customize it for each one based on your trading plan. This flexibility allows you to tailor the indicator to fit your specific approach, whether you’re a scalper or a swing trader.
Strategy Using Multi-Timeframe Moving Average Confirmation
Let’s break down a straightforward way to trade using this visual multi-timeframe system.
Buy Setup:
Set the period to 20 across your selected timeframes.
Wait until all arrows in the indicator are green.
Look for a bullish candle to close on the 30-minute chart as confirmation.
Enter a buy trade at market price.
Place your stop loss slightly below the recent swing low.
Set your target around the next key resistance or round number level.
Sell Setup:
Use the same 20-period setting.
When all arrows turn red, it’s time to consider a short trade.
Confirm with a bearish candle closing on the 30-minute chart.
Enter the sell at market price.
Put your stop loss just above the latest swing high.
Take profit near the next support or psychological price level.
This approach allows you to trade in the direction of the broader trend, using clean visual cues and reliable confirmation.
Final Thoughts on the MA Multi Timeframe Indicator
The MA Multi Timeframe indicator is a helpful addition to any trader’s toolkit. It makes it easy to identify trend alignment across timeframes at a glance and saves you the trouble of switching back and forth between multiple charts. This not only speeds up your analysis but also helps you stay focused during critical decision-making moments.
While it’s a great tool for confirming trend direction, it shouldn’t be used in isolation. For the best results, combine it with other elements like price action, support and resistance, or momentum indicators to build a well-rounded trading strategy.
Whether you're just getting started or refining your existing system, this indicator offers both clarity and convenience.


Reviews
Clear filtersThere are no reviews yet.